Reading the Chain: A Practical Guide to On-Chain Analytics for the Everyday American Crypto Investor
Why Price Charts Alone Are No Longer Enough
For most of crypto's early history, retail investors operated almost entirely on price action and sentiment. Charts, Twitter threads, and Reddit speculation formed the analytical backbone of the average American's investment process. That approach still exists — but it now competes with something considerably more powerful: on-chain analytics.
Every transaction on a public blockchain is permanently recorded and openly accessible. That means the movement of funds between wallets, the flow of tokens into and out of exchanges, the accumulation behavior of large holders, and dozens of other data points are visible to anyone willing to look. Institutional desks have been mining this data for years. Retail investors who have not yet incorporated on-chain analysis into their process are, in effect, reading half the market.
This guide is designed to change that. You do not need a computer science degree or a Bloomberg terminal to begin using on-chain data meaningfully. What you need is an understanding of which metrics matter, what they reveal, and where to access them — all of which we cover here.
The Foundation: What On-Chain Data Actually Measures
Before diving into specific metrics, it is worth establishing what on-chain analytics actually captures. Unlike traditional financial markets, where order books and trade data are often proprietary, blockchain networks record every transaction in a public ledger. On-chain analytics platforms aggregate, normalize, and interpret this raw data into readable signals.
The most useful categories of on-chain data for retail investors fall into three broad buckets:
- Exchange flows: The movement of tokens onto or off of centralized exchanges
- Wallet behavior: The activity patterns of large holders, long-term holders, and new market entrants
- Network health indicators: Metrics like active addresses, transaction volume, and miner or validator behavior
Each of these categories tells a different part of the market story. Learning to read them together — rather than in isolation — is where genuine analytical edge develops.
Exchange Inflows and Outflows: The Clearest Signal in the Data
When a holder moves tokens onto a centralized exchange, the most common reason is preparation for sale. Exchange inflows — particularly large, sudden spikes — have historically preceded price declines because they indicate that holders are positioning to liquidate.
The inverse is equally informative. When tokens move off exchanges into private wallets, it typically reflects an intent to hold rather than sell. Extended periods of declining exchange reserves suggest that supply available for immediate sale is contracting, which can support price stability or appreciation when demand holds steady.
Platforms such as Glassnode, CryptoQuant, and Nansen publish exchange flow data in near real time. For Bitcoin, monitoring the net exchange flow — the difference between inflows and outflows over a given period — provides a reliable gauge of short-term selling pressure. A sustained pattern of outflows alongside flat or rising prices is often interpreted as a constructive signal by experienced analysts.
For US investors, it is worth noting that exchange flow data from major platforms like Coinbase carries additional interpretive value. Coinbase, as the dominant retail and institutional on-ramp in the United States, sees disproportionate activity from American market participants. Analysts frequently track Coinbase-specific flows as a proxy for US institutional appetite.
Whale Watching: Understanding Large Holder Behavior
The term "whale" refers to wallets holding unusually large quantities of a given asset. While the threshold varies by asset, Bitcoin wallets holding 1,000 BTC or more are commonly categorized as whale-tier. These addresses collectively control a substantial portion of circulating supply, which means their behavior has outsized market impact.
Tracking whale activity does not require interpreting every transaction. Instead, focus on two primary behaviors: accumulation and distribution. When whale-tier addresses are consistently adding to their holdings during price weakness, it suggests that sophisticated market participants view current prices as attractive. When those same addresses are reducing positions during strength, it may indicate that the risk-reward profile has shifted.
Nansen's "Smart Money" labeling system and Glassnode's cohort analysis tools both offer accessible interfaces for monitoring these patterns without requiring raw blockchain data interpretation. Many of these platforms offer free tiers with sufficient data for retail-level analysis.
Long-Term Holder Metrics and What They Reveal About Market Cycles
One of the most reliable on-chain frameworks for understanding market cycle positioning is the distinction between long-term holders (LTH) and short-term holders (STH). Glassnode defines long-term holders as wallets that have not moved their coins in more than 155 days — a cohort that has historically demonstrated stronger conviction and lower sensitivity to short-term price volatility.
When long-term holders begin moving coins that have been dormant for extended periods, it warrants attention. This behavior — sometimes captured in the Coin Days Destroyed (CDD) metric — suggests that holders who survived previous downturns are choosing to realize gains, which can signal a maturing bull phase.
Conversely, when LTH supply is expanding — meaning coins are aging into the long-term holder cohort rather than being sold — it often indicates that the market is in an accumulation phase. Retail investors who track this metric gain a structural view of market positioning that price charts simply cannot provide.
Putting It Into Practice: A Simple On-Chain Workflow
Incorporating on-chain analytics into your investment process does not require hours of daily research. A focused, weekly review of a small number of key metrics can meaningfully improve decision quality.
Step 1: Check exchange net flows for your primary holdings. A sustained pattern of outflows is constructive; rising inflows warrant caution.
Step 2: Review whale accumulation trends. Use Nansen or CryptoQuant to assess whether large holders are adding or reducing exposure.
Step 3: Examine long-term holder supply trends. Rising LTH supply supports a patient, accumulation-oriented posture. Declining LTH supply may suggest it is time to reassess position sizing.
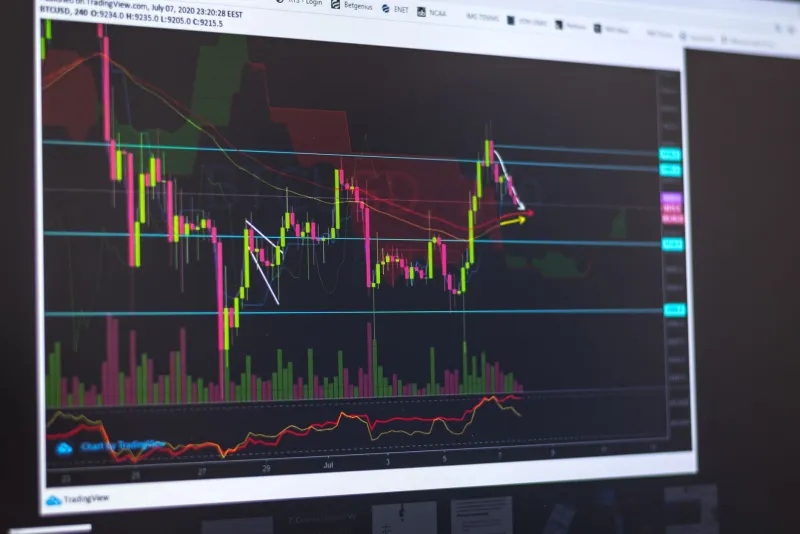
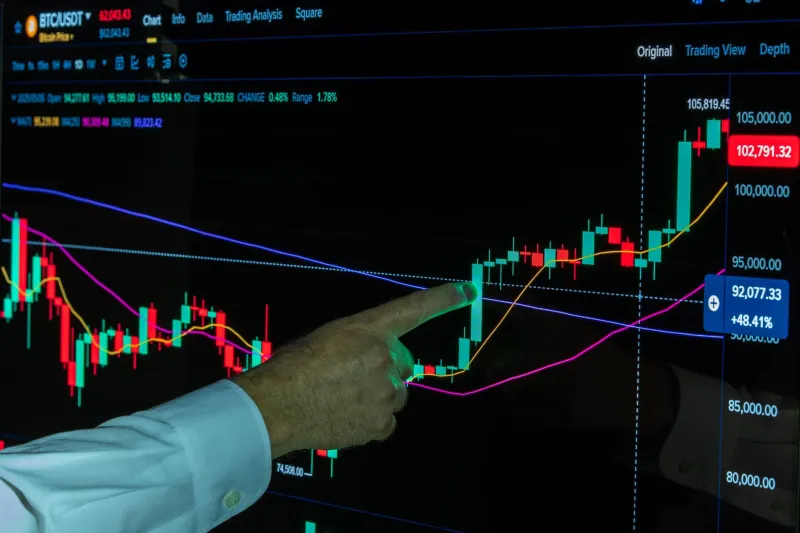
Step 4: Cross-reference with price action. On-chain signals are most powerful when they confirm or contradict what price charts suggest. Divergences — where price is rising but exchange inflows are also spiking — often deserve closer scrutiny.
The Retail Edge That Institutions Cannot Take Away
Institutional investors have access to proprietary data, sophisticated modeling, and dedicated research teams. What they cannot easily replicate is the flexibility of a retail investor operating with a clear analytical framework and the agility to act on it quickly.
On-chain analytics levels the informational playing field in a way that few other tools do. The data is public, the platforms are increasingly accessible, and the signals — while not infallible — have demonstrated meaningful predictive value across multiple market cycles.
At NugenCoin HQ, we are committed to equipping every investor with the tools and knowledge to trade smarter and invest with greater confidence. On-chain analytics is not a luxury reserved for professionals. It is a discipline available to any American investor willing to look beyond the price ticker — and it starts with a single metric, read consistently, over time.